Trace with intention
Learn which spans, probes, and synthetic checks actually illuminate delay — and which ones only add noise.
Latency literacy from Wando to the world
Infraedgenet Digital turns application analytics into readable latency maps — so your team can name bottlenecks, compare regions, and ship calmer releases.
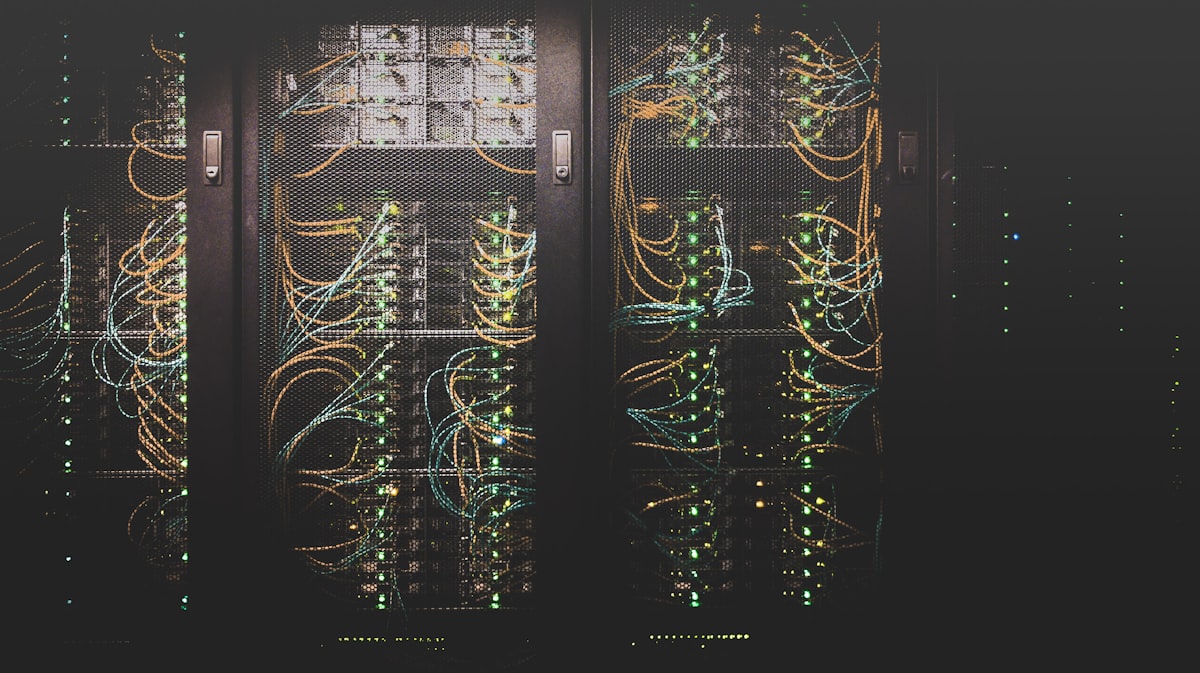
Programs stay grounded in application analytics for infrastructure latency mapping — not slide decks of abstract theory.
Learn which spans, probes, and synthetic checks actually illuminate delay — and which ones only add noise.
Translate raw timings into maps your product and platform peers can debate without a glossary.
Practice choosing the next fix when data is incomplete — a skill every Korean and remote squad needs.
Start with the studio most teams ask for, then branch into focused clinics.

Build end-to-end maps from edge to datastore and defend your reading in a live review.
Course details
Craft lightweight synthetic checks that reveal regional drift without flooding your backends.
View on courses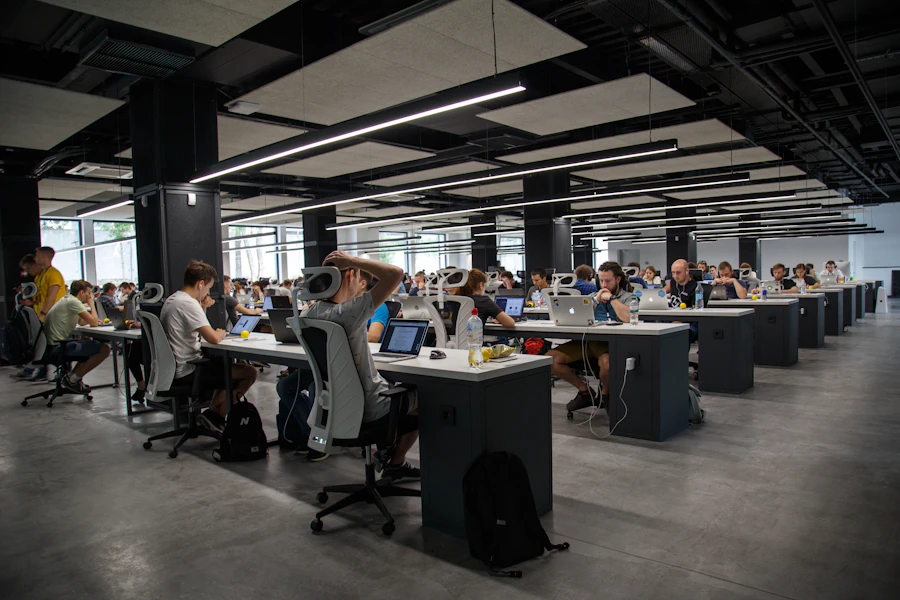
Turn post-incident timing dumps into a shared narrative your on-call rotation can reuse.
Browse programsTeams join for the maps — they stay for the habit of naming delay without drama.
Specific notes about modules on this site — not generic praise.
The “queue vs network” module in Latency Cartography Studio finally stopped our Slack debates from looping. We still argue — just with better diagrams.
Edge Probe Design was useful, though the homework load on week two felt heavy if you are already on-call. The regional drift templates repaid that effort.
We teach application analytics for infrastructure latency mapping with the same warmth we bring to every studio session — pastel calm, rigorous timing, zero fake urgency.
Talk with us